Clustering shot chains – Different types of chances and how much they are worth

Note: All the work presented in this post has been done together with my friend Tim Jonsson and has been supervised by David Sumpter. This post does get a little technical but hopefully the points will come across regardless of the level of statistical knowledge of the reader 🙂

Any football fan can subjectively distinguish between different types of attacks while watching a game, but doing this for every single game in a season, potentially over several different leagues, would be practically impossible. Using data from OPTA on the 2015/2016 season of the English Premier League, we set out to investigate whether we could automatically categorize attack types, in a way that resembles how we would subjectively categorize them manually, using k-means clustering.  We then took our clustering solution and used it in a logistic regression to investigate whether the attack type that led to the shot has an impact on the probability of the shot being converted into a goal.

Data preparation

Raw OPTA event data was used to identify chains of possession, i.e. an unbroken sequence in which a team is considered to be in possession of the ball. Next, only possession chains that led to a shot attempt were filtered out for analysis. 21 variables describing each ”shot chain” were then created. These variables include information such as the number of players involved in the chain, the length (in time) of the chain, the number of passes etc, and tries to quantitatively capture  ways in which we think that different attack types differ from each other. In the end, once own goals had been filtered out, we ended up with a data set of roughly 9600 observations where each observation corresponds to a shot attempt taken in the 2015/2016 EPL.

Clustering

Before running the k-means clustering algorithm, Principal component analysis was applied to reduce the dimensionality in the data.  Four principal components were retained for the clustering.

When using k-means clustering, one has to decide on the number of cluster before running the algorithm. We hypothesized that all attacks can be roughly divided into four attack types: Long possession spells, counter-attacks, counter-press and set-pieces. However, when running the algorithm using four clusters, the results were not exactly as hypothesized beforehand. The shots from various set pieces were spread out over different clusters, with penalties and direct free-kicks ending up in the same cluster, but shots from corners, throw-ins and non direct free-kicks ended up in another cluster. Furthermore, a specific cluster for shots from counter-pressing situations was not created. Instead, these shots were spread out between all other clusters apart from a cluster containing long possessions only. Finally, a separate cluster was not created for counter-attacks. Instead, various fast and short attacks were clustered together forming a cluster that can be labeled ”Direct play” rather than specifically counter-attacks.

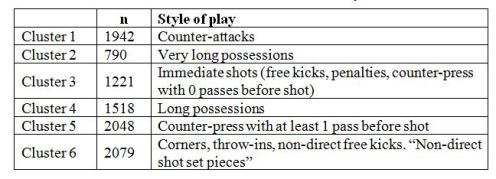
In order to refine the cluster solution the analysis was performed using several different number of clusters. The solution that was deemed best uses six different clusters to categorize the attack types. This solution solves some of the previously acknowledged problems with the four cluster solution, as it does create a cluster for all counter-pressing actions that have at least one pass in the sequence before a shot is attempted. It also manages to separate counter-attacks (starting in a team´s own half) and other direct plays that are now usually categorized with counter-pressing actions, as should be the case.  However, the solution still fails to separate free-kicks and penalties from shots taken immediately after a counter-pressing action.

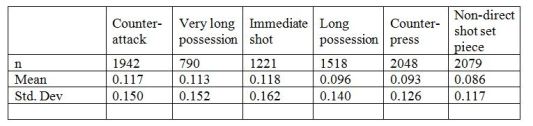
There is some overlap in the clusters, a few observations that are in fact counter-pressing shots are clustered together with non-direct shot set pieces,  but the general groups are quite clear and be seen in the table below (n = the number of observations in each cluster).

CLUSTERS

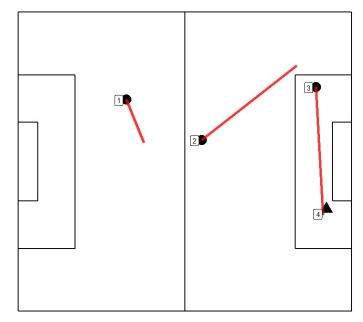
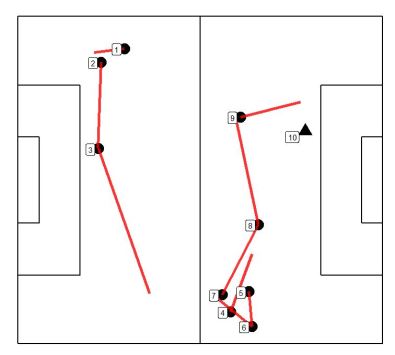
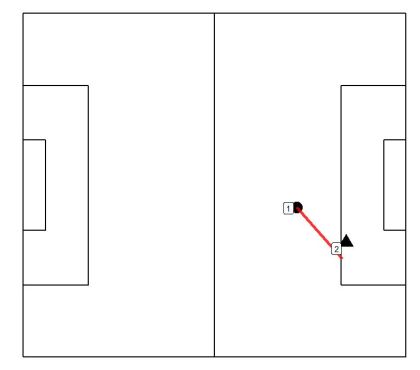
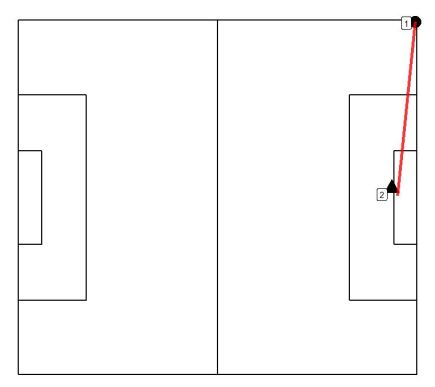
Below are plots showing one example attack from each attack type. Circles represent passes and triangle represents the shots, and the events are numbered by the order in which they occurred in real time. The lines show the paths of the passes. When there is a gap between the end location of a pass and the start location of the next event, a player might have moved with the ball, or any other action might have occurred that does not lead to the possession chain breaking with the definition used.

cluster1.5

Cluster 1 -Counter-attacks

cluster2.2

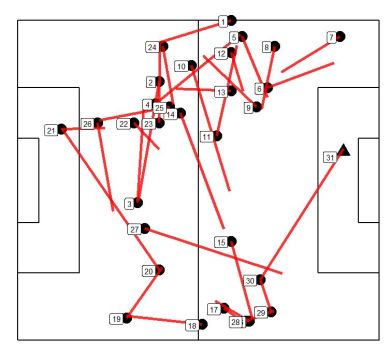
Cluster 2 – Very long possessions

cluster3.1

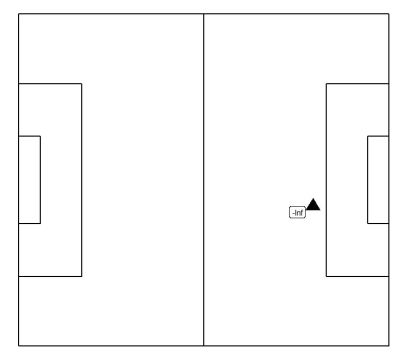
Cluster 3 – Immediate shots

cluster4.4.JPG

Cluster 4 – Long possessions

cluster5.2.JPG

Cluster 5 – Counter-press

cluster6.5

Cluster 6 – Non-direct shot set pieces

Effects of attack type on goal probability

To investigate whether different attack types creates chances of different quality a logistic regression was fitted to estimate the probability of a shot being converted into a goal using only information about the attack type that led up to the shot. The non-direct shot set pieces was used as the baseline level as this was the most common attack type. The coefficients from the regression (shown below) indicates that shots from counter-attacks, very long possessions and immediate shots are more likely to result in a goal as they have a positive sign and are significant at 5% significance level, compared to the shots from non-direct shot set pieces.

logistic

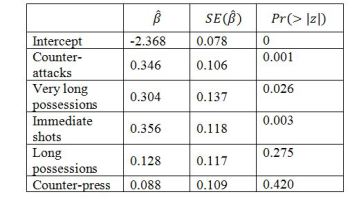
When controlling for location by including information about the distance and angle towards goal, all coefficients for attack types were positive and significant at 5% significance level. This indicates that given the same location, shots from non-direct shot set pieces are less likely to result in a goal.

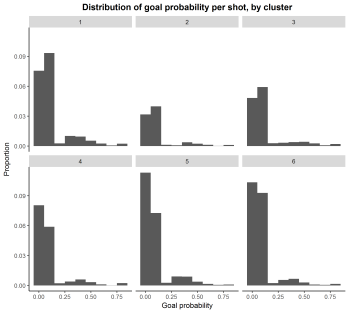
Next we fitted yet another model using information about the location, attack type as well as contextual information from the raw data about each shot to more accurately model the probability of a shot being converted into a goal. The distribution of goal probability per shot, by cluster is plotted below, as is the mean and standard deviation of goal probability for each cluster.

xgByCluster.png

clustersDistr.JPG

Finally, the non-parametrical Kruskal-Wallis and Dunn´s test were ran to investigate if there is any differences in the quality of chances created between all clusters, with results similar to those obtained from the logistic regression. Shots from counter-attacks, very long possessions and immediate shots are significantly more likely to result in a goal than shots from long possessions, counter-press and non-direct shot set pieces, but there are no sigificant differences in average goal probability within these two larger ”groups of groups”, so to speak.

Conclusion

Is it possible to automatically categorize attack types fraom data only using k-means clustering?
For the most part, yes, especially open play attack types. This method could potentially be used to scout teams and players from wherever we have data to get an understanding of how often a team uses a specific attack type and often different players participate in different attack types.

Do different attack types create different quality chances?
Yes. There is a significant difference in the quality of shot attempts generated from different attack types, at least during the EPL 2015/2016 season. It would be very interesting to see if the same conclusions hold over multiple leagues and seasons.

Stealing stuff – xGChain

It´s been almost to the day 18 months since I last posted on this blog. I barely remembered how to login. This, however, is not due to me falling out of love with analytics. On the contrary, I´ve been busy getting a degree in statistics (almost), learning how to program properly and co-starting an analytics consultancy business that just finished of our first season working with HV71 in the Swedish Hockey League with winning the gold (pretty damn excited about that!), so there has been little time to write blogs.

Now that hockey season is over and my thesis is almost done, there´s finally room for writing a blog every once in a while. I´ve been doing some work on possession chains and expected goals recently, and found myself realising that I was about 5 lines of code away from replicating Statsbomb services xgChain, so I just decided to do that and apply it on the 2016 season of Allsvenskan.

What is xGChain?

The xGChain was (to my knowledge) first introduced by the guys over at Statsbomb Services. It´s built on an Expected Goals model.

Expected Goals is a statistical model that assigns every shot attempt a probability of being converted into a goal. It is basically a model that tells you how good the quality of a shot is, based on it´s location and a bunch of other information regarding how the shot was assisted, etc.  You can read my explanation (in Swedish) following this link. My model uses data from OPTA to calculate these probabilities.

The xGChain takes this modelled value and assigns it (once) to each player participating in the possession chain that led up to that shot attempt. It goes beyond looking at only the player who took or assisted the shots, and credits all players (equally) involved in the sequence leading up to the shot, including the player shooting and assisting. I recommend you read the full explanation by Thom Lawrence if you want more details than that.

Results plz!

Running the code for the 2016 season of Allsvenskan and summing the xGChain values on a player basis, then adjusting for minutes played, we get the following top 20 in xGChain per 90 minutes played. (only players with more than 450 minutes played are considered)

xgChain90-2016

I like this list of players a lot. First, we should note that there might be a team effect as the list has tons of players from Malmö FF.  Second, I really like the fact that it throws up a bunch of well established top players in Allsvenskan, but also mixes in players like Kadewere and Aiesh (who both show up great in a lot of the stuff I look at) that might not be on everybody´s radar,  or at least wasn´t during the 2016 season when this data was collected. This is a good sign that the model picks up on player skill, and might be able to pick up when players are doing good things on the pitch without it necessarily being evident in the goals column.

If we remove shots and shot assists we get what Ted Knutson refers to as xGBuildup. This only credits the players participating in the possession chain up until the shot assist and so focuses less on attacking players and more on players participating in the build up of attacks. The top 20 for Allsvenskan 2016 according to my model looks like this:

xgBuildup90-2016

NOTE: This table has been updated as the intial code had a little bug in it that is now fixed.

Tobias Sana who admittadbly has few minutes played and a lot of them coming of the bench which might skew things in his favour, leads the way. Overall it´s an interesting lists that I once again feel captures players that we ”know” are good by the eye test but also some interesting names like fullbacks Dennis Widgren & Stefan Karlsson as well as young Christos Gravius (who also has few minutes played though). I also find Darijan Bojanic an interesting inclusion. He looks very interesting in several passing measures and should be a good fit at ÖFK if he can get on the pitch.

xGChain is not the end all be all measure of football analytics, but it´s an interesting addition to only looking at team and attacking player expected goal values to try and give some credit to players contributing to a teams attack in ways that might not be apparent from looking only at shot contribution measures.

This was fun! Hopefully it won´t be 18 months until next time.

Data from:

opta

Allsvenskan 2015: A quick summary

Allsvenskan 2015 has been truly amazing. Sure, there wasn´t much drama at the bottom of the league, but at the top the excitement lasted all the way through the last gameweek, with IFK Norrköping finally ending up as Swedish champions in 2015, having finished 12th the season before. Quite a remarkable development that I´m sure no one saw coming ahead of the season, I certainly didn´t, but Norrköping didn´t just win, they did it playing very entertaining football throughout the season with a squad consisting of a mixture of very interesting young prospects (Fransson, Wahlqvist, Bärkroth) and more experienced proven quality (Sjölund, Johansson), with golden boot winner Emir Kujovic being the main man scoring 21 goals. In the end, Janne Andersson added almost 19 points to his teams tally compared to bookie expectations.

JANNE

To round of the season on a team level (I will be back later with player stats), I thought I´d have a very quick look at the shooting statistics posted by all teams in the 2015 season. Unfortunately there´s very limited data available publicly on Allsvenskan, so we´ll have to settle with some basic shot ratios and conversion numbers.

_________________________________________________________________________________________________

In the bigger leagues, the Shots on Target Ratio (Shots on target For/(Shots on target For + Shots on target against)) does a pretty good job explaining what has happened on the pitch and usually shows a pretty strong correlation to points won. In short, creating more shots on target than you concede is, to no great surprise at all,  a very good idea. The chart below looks at the final Shots on target Ratios for all teams in the 2015 version of Allsvenskan.

sotr

The champions of 2013 and 2014, Malmö FF, actually posted the best SoTR, yet ended up in fifth place. Djurgården finished just behind Malmö in the league table, and did so in the SoTR ranking as well. Newcomers Hammarby finished 11th in the league table but posted some quite strong shot numbers, and might be due a regression in 2016.

In the bottom, Gefle sticks out. As they have been doing for several seasons in a row now, they posted some very mediocre shot numbers once again, yet stayed well clear of relegation, finishing 10th in the league. Apart from them, the teams with the worst Shots on target ratios are the teams that did end up in the bottom of the table. Both Åtvidaberg and Halmstad have been posting some very bad numbers from the very start of the season, and were never really close to avoiding relegation.

_________________________________________________________________________________________________

testplot

The chart above shows the Score%, that is the percent of shots on target that each team scored during the season. Right away we can see that reigning champs Malmö were let down somewhat by their finishing, as they scored 24.7% of their shots on target, which is bang on the league average. Way below the league average, at a measly 19.3% we find Hammarby, which helps to explain why they didn´t manage a better place despite posting some good numbers as far as shot volume goes. Gefle finished the fifth biggest share of their shots on target in the league, which in complete contrast to Hammarby, helps to explain why they finished way better than their shot volume implies. Whether Gefle are taking some very good (but few) quality chances and Hammarby worse ones (but many) than the league average is very hard to tell with the data available to me, but my hunch would be that they both might be in for some regression in the future.

_________________________________________________________________________________________________

When we turn out attention to the other side of the pitch and look at the Save%, that is the percent of shots on target conceded that a team managed to save, Djurgården and Hammarby make up the bottom 2, whichs further explains their drop down the table compared to their shot ratios. Malmö is once again very close to league average with their 74.4% of shots on target saved, which is some way from the 81.5% of IFK Göteborg and 77.7% of IFK Norrköping. Another one of the top sides, Elfsborg, does really poorly. Conceding high quality chances or being a tad unlucky? Bit of both?

save

Interestingly, relegated side Halmstad did quite well in this respect, conceding the third lowest % of their shots on target allowed. However, when you concede the fourth most shots on target in the league while creating the third least shots on target in attack, the fact that you save a good amount of the shots you concede might not be enough.

Defensively, IFK Göteborg really stand out. They conceded the least shots on target (119 compared to IFK Norrköpings 148 for instance) and saved the highest % of the shots they conceded. A lot has been said about how they missed central defender Thomas Rogne dearly once he got injured, which is probably true, but overall the loss of striker Lasse Vibe was probably a bigger blow as Göteborgs attack just wasn´t up to par with the best teams in the league. They scored the sixth most goals in the league, but only took the 10th most shots on target. Numbers like that make it hard to win any league, even with a very solid defensive output.

_________________________________________________________________________________________________

Way back in April I had a go at subjectively predicting the outcome of Allsvenskan 2015. Let´s just say I did not do too well.

prediction

For the next season I plan to make some sort of mathematical model instead, as subjective guess work clearly isn´t my strong suit. Wish me luck!

Märkt , , ,

Preview: Everton

Manchester United travel to Liverpool today, to face an Everton side that has had a positive start to the season earning 13 points in eight games.  A home win today would move Everton, currently in seventh place, above United in the league table. This is a big game for both teams, as a win for Everton would have them right in the battle for the European spots, whereas United need to bounce back from the awful defeat at the Emirates if they are to make a serious challenge for the title and hang on to their spot in the top four. This post will focus on mainly Everton and their underlying numbers on a team level, as well as who´s actually doing what in the 2015/2016 version of Everton, but will touch upon Uniteds numbers on a team level as well.

_________________________________________________________________________________________________

Team output

United and Everton have something in common this season. Both teams have had good or at least decent starts to the season points wise, but both are showing some seriously underwhelming underlying numbers. As far as creating expected goals goes, United have the 11th highest expected goals tally created from open play so far, with Everton in 14th. It is early days indeed, and the amount of time a team has spent either winning or losing will have a big impact on these numbers, but United seriously need to step up if they are to maintain their spot in the top 4. Everton have scored 12 goals from amodest ExpG tally of about 7.6 goals, and have probably been a bit fortunate in the attacking end of the pitch.

ExpGF

If you choose to look pass shots and focus on passes completed into the danger zone instead, things are looking a little bit better for both sides, but still far from great. United have managed just under 5.4 passes into their opponents danger zone per game, some way from the 8.9 passes completed per game by Arsenal (leauge leaders in this category) and only the eighth best record in the league. Everton are in 11th, completing 4.9 passes into their opponents danger zone per game.

passesIntoDZPG

_________________________________________________________________________________________________

United have been getting a lot of credit for their defensive displays this season, and for a while their defensive numbers were indeed quite impressive, but that might unfortunately have changed. Away to Southampton, United conceded 13 passes into the danger zone (league average is just over 5) and two goals, and the defensive display in the opening 20 minutes of the game at the Emirates wasn´t exactly taken out of the handbook for defensive play either. The ”good” news is that Everton are doing even worse. United in 10th have conceded only 1.4 expected goals more than Bournemouth that have conceded the second least expected goals, whereas Everton in 11th have conceded 1.5 more expected goals than United.

ExpGA

United are right in the middle of the league when it comes to conceding passes into the danger zone as well. Quite unimpressing, but again, Evertons defensive display is far worse. In fact, Everton have conceded the same amount of passes into their danger zone as Steve McClarens Newcastle, and the only two teams to concede more passes into the danger zone so far this season are West Ham and Sunderland.

passesConcIntoDZPG

_________________________________________________________________________________________________

Attacking contribution

Now lets focus on Everton and their attacking numbers. It´s no great surprise to see that Romelu Lukaku is taking the most shots out of the Everton players with meaningful playing time (minimum 270 mins played), followed by Ross Barkley who´s taking almost three shots per game so far. Behind those two, there´s quite a drop off to Arouna Koné who´s taken the 3rd most shots with 1.93 per 90 and Steven Naismith with 1.89 shots per 90 minutes played.

Shots90

However, when you take shot quality into consideration and look at expected goals instead of just raw shot numbers, Ross Barkley falls down the ladder implying that he shoots a lot from poor positions (could you imagine?). Lukaku is posting a very solid 0.4 ExpG90 an Naismith an acceptable 0.25 ExpG90.

_________________________________________________________________________________________________

With key passes, a similar story arises. Tom Cleverley has made the most key passes per 90 minutes played, but when you adjust for the quality of the shots that he is assisting, his ExpAss90 doesn´t even make the top 5 in the team. Ross Barkley, who has the 2nd most key passes, seems to be providing not only the most, but also the best shots for his team mates.

KP90 ExpAss90

_________________________________________________________________________________________________

Passing

Everton under Roberto Martinez have a reputation for being a possession oriented side. but eight games into the 2015/2016 season, ten(!) teams have attempted more passes than Everton (United have attempted the most passes of all teams), among those ten teams are sides such as Norwich and Bournemouth.

The density plot below (created with code from @jalapic) shows Evertons attempted passes this season. Unlike Wolfsburg, that I wrote a scout report on before their visit to Old Trafford, Everton seems to do most of their passing in central areas occupied by their defensive midfielders.

evertonPasses1516

If we look at the number of passes each player make per 90 minutes played, the top list pretty much consists of only central players and Seamus Coleman, with Gareth Barry seeing most of the ball.

evePasses90

The chart below shows passes in the final third, where Ross Barkley again stands out as the main playmaker in Evertons attack, alongside Tom Cleverley, though the latter has only registered 311 minutes of playing time so far, compared to the 720 minutes racked up by Barkley.

evertonFinal3rd

_________________________________________________________________________________________________

To sum it all up, Everton and United both are posting pretty poor numbers so far this season, though game states are still very much at play, in particular when looking at the shooting numbers.

In last seasons encounter at Goodison Park, Everton were happy to let United possess the ball, and countered United to pieces winning, 3-0. Given van Gaals love of the ball and the fact that Everton seems less possession oriented this season than what we´ve become accustomed to, they are likely to try something similar this year, which might make it harder for United to exploit the defensive weaknesses of Everton, as they might sit deeper than usual and allow less space and fewer passes into the danger zone.

I´m yet to be convinced by this seasons version of Manchester United, and this would be a very nice time for the team prove me wrong. Please do so!

Passes into the danger zone

A week ago I wrote a post looking at passes into the penalty area at a team level, investigating the strength of the correlations between the amount passes into the penalty area for/against and goals scored/conceded, as well as the correlation between a penalty area pass ratio and points won.

This post will be pretty much identical to that post, that you can read by clicking this link, but using a slightly different measure. Rather than looking at passes into the penalty area, this post will be looking at passes completed into the danger zone (from outside of the danger zone).

Said danger zone has the width of the 6-yard box, and the length of the 18-yard box, as the illustration below shows.  It is labeled the danger zone as this is the area where the vast majority of goals are scored in football.

DZ

___________________________________________________________________________________________________

Using data from last seasons Premier League and Bundesliga (unfortunately I only have one seasons worth of data to play with), I checked the same correlations as in the previously mentioned post.

goalsForVsPassesFor goalsAgainstVsPassesAgainst PPGvsDZpassDiffPG

It turns out, perhaps not very surprisingly, that the danger zone measure does a little better overall than the penalty area measure. On the attacking side, the penalty area measure actually does a tiny bit better than the danger zone measure explaining goals for, but when we look at the defensive side, the danger zone measure does a lot better explaining just under 37% of the variation in goals against versus just over 27% for the penalty area measure. As a consequence of this, the ”Danger zone pass differential per game” has a stronger correlation to points won per game than the previously investigated ”Penalty area pass ratio”, with the former explaining 51,6% of the variance in points won versus 45,7% for the latter.

Before I have a go at the repeatability and the potential predictive power of this measure, I might have a look at one or two more passing measures that I have in mind too see how well they explain these things, compared to the measures I´ve already looked at.

_________________________________________________________________________________________________

As a bonus, here´s how the teams in the Premier League and Bundesliga fared in the Danger Zone passing measures in 2014/2015.

DZpassesForPL1415 DZpassesAgainstPL1415 DZpassDiffPL1415 DZpassesForBun1415 DZpassesAgainstBun1415 DZpassDiffBun1415

Märkt , , ,

Scout report: Wolfsburg

Tonight Manchester United host Wolfsburg in what has a become a very important fixture for the Reds after losing away to PSV Eindhoven in the first round of the Champions League group stage. Wolfsburg had a fantastic 2014/2015 season and finished second in the Bundesliga, but since then they´ve had to rebuild their squad a little bit after losing Kevin De Bruyne and Ivan Perisic to Manchester City and Internazionale. Julian Draxler and Max Kruse has been brought in to fill the gaps left by De Bruyne in particular, and Brazilian centre back Dante has been brought in from Bayern Munich to improve the team at the back.

I´ve only watched Wolfsburg twice this season, including the nasty 1-5 defeat away to Bayern (featuring the famous nine minutes of Lewandowski), but since I have some extensive data from the Bundesliga I thought it´d be a fun idea to put that data to use and see if I can try and profile Wolfsburg as a team to try and figure something out about how they want to play their football.

_________________________________________________________________________________________________

Underlying numbers

Wolfsburgs start to the season hasn´t quite lived up to the expectations created by the very successful 2014/2015 campaign. They currently sit fourth in the table with 12 points gained through three wins, three draws and the loss against Bayern. The Wolfs are four points behind Schalke, five behind Dortmund and nine points behind Bayern. Not a terrible start by any means, but probably slightly below the fans hopes and expectations.

The underlying numbers offer no consolation to Wolfsburg fans so far. They are fifth in TSR and the expected goals numbers are even harsher on the Wolfs, currently ranking them the sixth best team in Germany, though sample size is obviously an issue this early in the season.

bundesExpGD

If you separate attack from defense, it becomes evident that Wolfsburgs issues so far are mainly attacking ones. Apart from Bayern and Dortmund, the two dominant sides so far, Wolfsburgs expected goals against are the lowest in the league, despite the fact that they´ve already played Bayern away from home. On the attacking side, however, things are looking a lot worse.

ExpGA ExpGF

Seven teams have taken more shots than Wolfsburg so far, but what´s even more worrying for the Wolfs is the fact that only five out of the 18 teams in the Bundesliga teams have taken shots with a lower expected goals number per shot. When you plot Wolfsburgs shots taken, it´s not very hard to tell why that is (red shots are misses, blue=goals, and the bubble size indicates ExpG value).

wolfsburgShotsTaken

That´s a LOT of efforts from range, and if you exclude that big blue dot from the penalty spot, Wolfsburg expected goal difference would be down to just +1. At this stage of the season, it seems that Wolfsburg are yet to find a way to make up for the loss of Kevin De Bruyne.

_________________________________________________________________________________________________

Defensive actions

Different teams defend in different ways, and in different areas of the pitch. The plot below is a density plot showing where Wolfsburgs tackles and interceptions has happened so far this season (R code shamelessly borrowed from @Jalapic).

WolfsburgDefensiveActions

This might not say to much in a vacuum, but when you include a list of who´s actually making these tackles and interceptions, a pattern emerges that allows us to draw a few conclusions on Wolfsburgs defending.

tacklesInts90

Lets focus first on the central attacking players, Max Kruse and Bas Dost. They basically don´t tackle or intercept at all. Julian Draxler, who´s been deployed both centrally and wide left, does very little as well. I think it´s safe to assume that Man Uniteds centre backs will get a lot of time on the ball, as Wolfsburg opts not to press very aggressively from the front, especially not through the middle.

if we look at the players usually deployed at wide midfield and fullbacks, neither of the wide left midfielders (Schürrle/Draxler) does a whole lot of defensive work, and compared to the right backs (Träsch and Vieirinha), left back Ricardo Rodriguez also does a lot less.

Träsch and Vieirinha on the other hand do a lot defensively, especially Träsch, but apart from them, the players that do most of the defensive work in Wolfsburg are players in the centre of the field. Centre backs Naldo and Dante both do their fair share, as do Luiz Gustavo (who might miss the game due to injury), but the numbers that stick out the most are the very high numbers of Josuha Guilavogui, and to some extent Maximilan Arnold. Wolfsburg do appear to have a very physical set of players in the central parts of the field, doing most of the ball winning work for the team.

All in all, with Daniel Caligiuri at wide right doing a lot more defensive work than either of the left wingers, and the right full backs doing a lot more than Ricardo Rodriguez, and the central players doing the majority of the defensive work, it might be a good idea for United to focus their attacks down the right wing, where Wolfsburg seems to do the least defending.

_________________________________________________________________________________________________

Passing:

Wolfsburg have been one of the most possession oriented sides in the Bundesliga so far. Only Bayern and Borussia Dortmund have made more passes per game, and apart from those two, only Gladbach have played a smaller percentage of their passes forward than Wolfsburg. passesPerGame fwdPasses

So Wolfsburg usually pass the ball a lot. But where do they pass, and who does the passing? This is a density plot over all passes attempted by Wolfsburg this season:

wolfsburgPasses

Most of the passing seem to be happening out wide (especially to the right) and at the back. with very little going on centrally in the attacking half. The plot below shows who´s doing most of the passing at Wolfsburg this season, with the larger circles implying a higher number of passes per 90 minutes played. For clarity, the number of passes per 90 is included below the player names as well.

passes90

This furthers the point from the density plot, showing that the six players that have had meaningful playing time at the back in Wolfsburg this season, are the ones with the most passes per 90 minutes as well. Max Kruse and Julian Draxler have attempted roughly the same amount of passes, just a few passes short of Kevin De Bruynes 51 passes per 90 from the 2014/2015 season.

When filtering for passes that ended up inside the final third, Wolfsburg do fall down the ladder a couple of spots, with newly promoted Ingolstadt and Vfb Stuttgart completing more passes in that area.

final3rd

To try and measure how direct teams are, we can use a simple ”Passes per shot” metric. As it turns out, only Borussia Mönchengladbach have attempted more passes for every shot taken in the Bundesliga this season, further proving the point that Wolfsburg is indeed one of the most possession oriented teams in the league.

passesPerShoy

_________________________________________________________________________________________________

Shots & Key passes

We´ve seen so far that Wolfsburgs defensive numbers are quite good, but the attack is lacking somewhat. Replacing the 10 goals and 20 assists delivered by Kevin De Bruyne was never going to be easy, and as is always the case with new players such as Kruse and Draxler, they might need some time to settle before they find their best form.

So which players are Wolfsburg relying on to create chances at the moment? The charts below shows Shots and Key Passes per 90 minutes played.

shotsPer90

kp90

Bas Dost is taking by far the most shots with just under 3 shots per game, which isn´t too impressive as a lone striker in a top team, though in his defence he usually takes shots from some superb locations. Overall, I would have expected a few more shots from the likes of Kruse, Draxler and Schürrle, who has yet to impress since his switch from Chelsea last season.

It is instead Daniel Caligiuri who is taking the second most shots per 90 mins behind Dost, while also providing the most Key passes, beating two usually creative names in Kruse and Draxler. 27-year old Caligiuri had had an inspiring start to the season, contributing with both shots and assist, as well as some defensive work. In total, Caligiuri is contributing directly to roughly 6.8 shots per 90 minutes played, Kruse 5.4 shots and Draxler 4.8 shots.

_________________________________________________________________________________________________

Summary:

Man United will host a side that hasn´t quite reached the form of last season. Defensively Wolfsburg are very solid, but as we have seen they usually don´t pressure very high up the pitch, especially in the central areas. Instead it is the defensive central midfielders and the back four that does most of the defensive work.

Wolfsburg usually do see a lot of the ball, and again it is the central midfielders and the back line that sees the most of it. The central line seems very important to Wolfsburgs game, given how involved they are in both passing and defending. The full backs are very involved in Wolfsburgs passing game, as is the centre backs, implying that they like to play out from the back and potentially keep possession as a means of defending as well as attacking. Both fullbacks do contribute going forward, as they provide about two key passes each per 90 minutes. However, it is Daniel Caligiuri and Max Kruse that has provided the vast majority of key passes, with lethal striker Bas Dost being the most common recipient of said key passes. Julian Draxler has settled in ok, posting the 3rd highest numbers for both shots and key passes per 90 minutes.

It´ll be very interesting to see how Wolfsburg approach tonights game. The data for this analysis comes from the seven games played in this seasons Bundesliga, in six of which Wolfsburg were favourites. That is not the case tonight, and in reality we have little information on how Wolfsburg will react to this type of game, as they haven´t been in the Champions League for some time. I´d expect them to set the team up a bit more conservatively, defend deep and compact, and to counter attack a bit more than usual, given that a draw would be a great result for Wolfsburg.

_________________________________________________________________________________________________

Data from:

opta

Märkt , , , , , , , , ,

Passes into the penalty area – Premier League and Bundesliga 14/15

A couple of weeks ago I wrote a post comparing Kevin De Bruyne and David Silva in which I started looking at completed passes, both into the final third and into the penalty area, without really explaining much about why this might be an interesting topic to look at. In this post I´ll focus on completed passes into the penalty area, using passing data from the Premier League and Bundesliga from the 2014/2015 season.

The definition of a completed pass into the penalty area is pretty much self explanatory, it is a pass that is attempted outside of the penalty area and is successfully received inside the penalty area. Alternative but very similar measures could be passes completed into the ”danger zone” or just completed passes inside either the penalty area or danger zone regardless of whether they were attempted from inside or outside of those areas. I do plan to investigate these alternative measures as well at some point, but as mentioned above, todays focus is on completed passes into the penalty area, on a team level.

_________________________________________________________________________________________________

First up, a few correlations. I used data from both the Premier League and the Bundesliga for these correlation charts, as the league samples would have been quite small on their own. One seasons worth of data is still a small sample, and I´ll make sure to investigate these correlations further as I gather more data in the future. With that said, let´s have a look at a few plots:

corrSuccPenAreaPassesForvsGoalsFor corrSuccPenAreaPassesConcVsGoalsAgainst

There´s a pretty decent correlation between passes into the offensive penalty area and scoring goals, with the number of successful passes explaining 47% of the variance in goals scored per game. As is almost always the case when looking at team metrics, defensive performance is much harder to predict and the correlation between passes conceded into the defensive penalty area and goals conceded is quite a bit weaker, with passes conceded into the penalty area explaining only 27% of the variance in goals conceded.

If you want to take it one step further (and I do), you can turn the passes completed and conceded into a ratio, much like the ”Total shots ratio” or the ”Shots on target ratio”, and see if there´s a correlation to points per game (or goal difference if you´d prefer that).

corrSuccPenAreaPassRatiovsPointsPerGame

So looking solely at last seasons numbers, there is a correlation between points earned and the ratio of passes completed/conceded into the penalty areas, but it´s not a whole lot stronger than raw possession, and it´s weaker than the shot ratios. It´s still strong enough to be useful in my opinion, certainly for team profiling purposes if nothing else.

It it´ll be interesting to compare this correlation to the ones of alternative passing metrics to see if there´s a stronger correlation to be found when looking at a slightly different area or a slightly different set of passes. As I gather more data, season to season repeatability is another very important issue that needs to be adressed as well as possible differences in style of play between leagues.

_________________________________________________________________________________________________

Premier League 2014/2015

So lets have a look at the numbers from both leagues last season. First chart: Passes completed per game in the Premier League:

FORpl1415

This chart tells a similar story to the ones that were told by many different metrics last season. City and Arsenal were both excellent, Southampton did great, United were lucky, Tottenham even more lucky, and Swansea were terrible.

Relegated side Burnely is a surprising inclusion in the top 5, completing more passes than both Man United and Liverpool. Spurs acquisition Kieran Trippier turns out to be the player who completed the fourth most completed passes into the penalty area per 90 minutes played in the entire league, boosting Burnleys numbers quite a bit.

PenAreaPassesEPL1415

The bottom 5 hold some dull and not very surprising teams, with the exception of the previously mentioned Swansea side that managed to finish 8th in the table despite being the leagues worst team by a bit when it comes to passing the ball into the opponents area. If you´re worse than Sunderland at anything, that´s not a very good sign.

_________________________________________________________________________________________________

AGAINSTpl1415

Defensively, Swansea did a little bit better, but still really bad. QPR:s struggles were mainly at the defensive end of the pitch, and the same goes for West Ham. Tottenham ends up in mid table, and Burnley once again does surprisingly well in this metric.

When you combine the defensive and attacking numbers into a ratio, you get the following result:

ratioPL1415

Man City might have been a decent side last season. Surprise surprise.

Swansea and Tottenham still stand out as the two teams that did remarkably well given hos poor they were not only in this metric, but in all the shot metrics as well. Burnley were truly unlucky to be relegated judging by this metric alone.

_________________________________________________________________________________________________

Bundesliga 2014/2015

FORbun1415

It´s no great surprise that Bayern Munich sits top of the list, but it is all the more interesting to note yet another measure where Borussia Dortmund does really well, in fact better than all other teams bar Bayern. Gladbach, overperfoming wildly compared to their shot metrics does quite poorly in this one as well, not to mention Schalke 04. Werder Bremen does surprisingly well going foraward, and Wolfsburg surprisingly bad.

AGAINStbun1415

This was more like what I was expecting from Werder Bremen, who clearly struggled a lot more defensively than going forward. Gladbach looks even worse when it comes to restricting passes into the penalty area, and Schalke looks mediocre once again. Wolfsburg does well, Dortmund great and Bayern even better. The Dortmund debacle from last season that saw them finish 7th while posting the second best scores in pretty much every single metric I´ve looked at so far is mind boggling, and a great reminder of what a pain variance can be over even extended periods of time. Dortmunds shot profile was super strong all season, up there with the best, yet they found themselves dead last when half the season was played. That is brutal.

Oh well, on to the ratios:

ratioBun1415

It seems Thomas Tuchel didn´t inherit such a bad side after all.

Thanks for reading!

Märkt , , , ,

Allsvenskan – 24 down, six to go.

With just six games remaining of the incredibly tight and entertaining 2015 season, the fight for the gold finally appears to have been narrowed down to three teams, although all of the top six teams could´ve very well been up there fighting judging by their very even shot numbers. The difference between Djurgården in sixth place and IFK Göteborg at the top of the table is solely down to a difference in PDO, as their shot ratios are more or less identical. The shot numbers do a great job of explaining just how tight and exciting this years version of Allsvenskan has been, with the almighty Champions League-participant Malmö FF looking likely to miss out on the top 3 and a qualifying spot for the Europa League next season.

As the table below shows, current leaders IFK Göteborg are very defensively solid, having conceded only 90 shots on target all season. As far as creating shots on target on their own, IFK Göteborg are actually the worst out of the top six teams by some margin. Malmö FF of the other hand, are best in the league when it comes to creating shots on target, and have only conceded less shots on target than the above mentioned IFK Göteborg and Djurgårdens IF, leading to the leagues best Shots on Target Ratio. Malmö can definitely count themselves a bit unfortunate to not be in the running for the gold medals this year.

allsOmg24

It took them long enough, but Örebro has finally picked up some pace and left the relegation spots. Their PDO is still the lowest in the league, but things are certainly looking up for them and as I´ve been maintaining all season, they don´t look like one of the worst teams in the league as far as shot numbers goes. Defensively yes, they are quite bad having  conceded the second most shots on target in the league, but offensively they are quite strong, as the fact that they have actually created more shots on target than leaders IFK Göteborg up to this point shows.

Gefle are an intruiging side. For the second year running their shot numbers are among the worst in the league, yet their results this season tell a different story, with Gefle parked in seventh place right now, thanks to a PDO of 103. They were close to relegation last year, and I haven´t seen enough yet to be convinced that this seasons results isn´t just down to some positive variation, but it´ll be interesting to see whether they keep outperforming their shot ratios in the future.

As the two direct relegation spots look destined to belong to Halmstad and Åtvidaberg, the race is very much on to avoid the 14th place and a knock out tie to stay in the league. GIF Sundsvall, Hammarby, Kalmar, Örebro and Falkenberg are all very much in danger of ending up in 14th, with Falkenberg occupying that spot for the time being. Falkenberg do look like the weakest out of these teams, with Hammarby looking no way near as bad. ”Bajen” actually look like a solid top half side that have been let down by some poor finishing.

_________________________________________________________________________________________________

The table showing points added over expected points gives IFK Norrköping coach Janne Andersson a lot of credit, as his side has managed to earn almost 12 points more than the bookmakers have expected them to. IFK Göteborg, AIK and Gefle have surprised the bookies in a positive manner as well, with all of AIK:s ”overperformance” coming at home.  At the other end, Åtvidaberg, Hammarby and Halmstad have been the biggest letdowns of the season. As mentioned above, Hammarby seems to have been a bit unlucky, whereas Halmstad and Åtvidaberg are simply quite bad, and have been pretty much from tday 1 of the season.

allsExpoints24

Märkt , , ,

Kevin De Bruyne is not David Silva

The international break that followed deadline day is soon to be over, so I thought I´d take a more in depth look at a transfer that hasn´t really been paid that much attention given the size of the deal. The fact that rivals Manchester United went ahead and paid a gazillion pounds for a relatively unknown young French striker (feel free to read my thoughts on that transfer HERE) sort of took the spotlight away from the deal that took Kevin De Bruyne to Manchester City from Wolfsburg for a fee of 75M€ according to Transfermarkt.com.

The 24 year old Belgian who left Chelsea for Wolfsburg in January 2014 had an incredible 2014/2015 season in Wolfsburg, scoring 10 goals and providing no less than 20 assists from his preferred nr 10 role in which he started the vast majority of games for Wolfsburg last season.

The fact that City decided to spend that amount of money on an attacking central midfielder begs the question: What will happen to David Silva?

Silva was deployed as a winger with a lot of freedom to roam in Pellegrinis 4-4-2 for large parts of last season (23 out of his 32 starts saw him start to the left), but has excelled in a more central role in the beginning of the new season. Will the arrival of De Bruyne see Silva moved back out wide, or is it De Bruyne that will initially have to move out wide to make room for Silva? In this post I will be looking at some Opta passing data from the 2014/2015 season to see if we can spot any similarities and/or differences between the two potential Man City nr 10:s, and maybe even try and answer the question of who´s the better fit as a central or wide midfielder?

_________________________________________________________________________________________________

First of all, it should be noted that Silva and De Bruyne played for very different teams last season. In fact, they played in quite different leagues. The Bundesliga is a fair bit more open and action packed than the Premier League where more teams tend to sit back and defend. Manchester City, being one of the teams in the Premier League that control play in more or less all their games, play a style that is a lot more possession oriented than Wolfsburg, but how big is the difference in passing style between the two teams?

TeamPassingStats

City attempts roughly 80 passes more per game whan Wolfsburg, completing 82.7% of their passes, compared to a 78.2% completion rate for Wolfsburg. As we can see from the bar chart, City succeed with more forward passes per game, but when you compare that number to the amount of succesful passes each team plays per game, Wolfsburg actually play their succesful passes forward a tiny bit more often than City does (60.1% vs 59.6%).

So what about the players in question? The bar chart below shows the raw numbers of passes, successful passes and successful forward passes per 90 for Silva and De Bruyne.

PlayersPassingStats

David Silva is clearly playing more passes than De Bruyne, and his passes are also more successful in reaching it´s target. Silva completes 84% of his passes, whereas De Bruyne completes only 71.3% of his passes, despite the fact that they both play an almost identical 53% of their successful passes in the forward direction. This could either mean that Silva is a much better passer than De Bruyne, or that the passes that De Bruyne attempt are much harder than the ones Silva attempt, or a combination of both.

So that´s the raw number of passes. When we look at each players numbers as a Usage Rate, that is, we divide the players number for each statistic by the teams number for the same statistic, we get the following chart:

UsageRatesThe picture remains largely the same. David Silva is clearly more involved in Citys general passing game than De Bruyne was at Wolfsburg, regardless of whether we´re looking at all passes or successful forward passes.

So we know how many passes they both made per game last season. But where did they make them? Using R code from James Curley (Twitter: @jalapic) I´ve created density plots for all passes by Silva and De Bruyne respectively from the 2014/2015 season. The top one is Silva, and the bottom one De Bruyne. I´d say, they reveal some interesting patterns.

DavidSilvaPasses1415 DeBruynePasses1415

If we focus on David Silva (the top plot) first, what instantly sticks out is the fact that even though he started most games to the left, and when he didn´t start to the left he started centrally, the area where he played most of his passes is on the right hand side of the pitch. License to roam indeed, and potentially an orientation towards the right.

When we look at De Bruynes plot, we learn that, conversely, even though he started centrally for the most part, the area where he is most active with his passes is to the left. We can also see that the ”epicentre” of De Bruynes passing is farther from goal, actually closer to the half way line than the penalty area, whereas Silvas ”epicentre” is much closer to the box.

Obviously, this could be a result of tactical instructions on both ends, but it is quite interesting to see that De Bruyne is most active on the left side of the pitch, and Silva on the right side of the pitch. Is this a coincidence, or could this be something that the analytics team at City picked up as well?

_________________________________________________________________________________________________

Let´s move into the final third. Once again, it needs to be pointed out just how differently City and Wolfsburg play. Take a look at the chart below. The leftmost bars shows the amount of successful passes into the penalty area per game, the bars in the middle shows the successful forward passes in the final third per game, and the rightmost bars shows the amount of forward passes in the final third. I think it´s fair to say that City spend a lot more time passing the ball in the final third.

TeamsFinalThirdPassing

So on to our players. Let´s have a look at the same stats, but on a player level. The first chart shows the raw number of passes in each category, and the second chart shows the Usage Rates for each player.

PlayersFinalThirdPassingRaw

PlayersFinalThirdPassingUsage

From the raw numbers we see that Silva plays a lot more passes in the final third, but when it comes to successfully getting the ball into the penalty area, De Bruyne actually beats Silva in raw numbers per game. Given that Wolfsburg succeed with only 9.7 passes into the penalty area per game compared to Citys 16.3 passes per game, that is pretty huge on De Bruynes part. As you can tell from the Usage chart, De Bruyne was pivotal (to say the least) in Wolfsburgs attack last season, with a Usage Rate of more than 45% as far as successful passes into the penalty area goes, compared to 22.9% for David Silva. Silva does still beat de Bruyne in Usage Rate for the passes in the final third, but only just.

_________________________________________________________________________________________________

Lets have a look at production. As I mentioned early on in the post, De Bruyne had a spectacular 2014/2015 season. In terms of actual output, De Bruyne beat Silva in NPG90+Ass90 (Scoring Contribution 90) comfortably (0,89 vs 0.65), but realistically, that was probably down to some positive variation in finishing from both De Bruyne himself and his team mates (I´m looking at you Bas Dost). When you stack up the Expected Goals and and Expected Assists per 90 minutes played, De Bruyne and Silva have totals that are very similar, with Silva posting a higher ExpG90 value and De Bruyne a higher ExpAss90.

ScoringContribution

Since this post is focusing on passes, and this is the production section, let´s look at something that can lead to production, Key passes. De Bruyne managed 3.3 Key Passes Per 90 minutes in 2014/2015, beating Silvas 3.1 KP90.

Using the excellent Tableau tutorials from Brian Prestidge (Twitter: @BrianPrestidge) I created two passing maps, showing the origin and end of all key passes that Silva and De Bruyne logged in 2014/2015. Light blue passes lead to shots that wasn´t converted into goals, whereas red passes lead to shots that was converted. Once again, Silvas map is the top one.

SilvaKeyPasses DeBruyneKeyPasses

Silvas Key passes are mainly clustered centrally just outside of the penalty area and consisting of shorter passes, whereas De Bruynes passes are a bit more all over the place, they are generally longer, and quite a few of them are from corners. When stripping out Key passes from corners, Silvas KP90 turns out to be 2.94, beating De Bruynes 2.42 KP90.

_________________________________________________________________________________________________

Time to summarize. David Silva was more active in Citys overall passing game in 2014/2015 than De Bruyne was at Wolfsburg. As we moved into the final third though, De Bruyne was still making less passes than Silva in raw numbers, but when looking at the Usage Rates, dividing the individuals numbers with the numbers of his team, De Bruyne shone when it came to successfully passing the ball into the penalty area, and equalled Silva in final third passes.

Silva seems to be attracted to the right, and De Bruyne to the left.

Finally, one more graph. I´m not entirely sure if this graph shows a difference between the players in question or the leagues/teams that they played in/for last season (I would guess that it´s a combination), but I still found it noteworthy enough to include.

PlayersDirectnessAll in all, I feel like we have some evidence to suggest that David Silva and Kevin De Bruyne are different player types that occupy slightly different areas of the pitch. Silva is a short passing wizard that thrives in small spaces, operating just outside the penalty area and drifting a little bit to the right. De Bruyne is less involved in build up-play but contributes a lot in the final third, seems to be a more direct player that plays more long passes and drifts to the left.

So who will play in what position, and where do you fit Raheem Sterling in? Those are some tricky questions, but at the same time the kind of questions any manager would love to have to try and answer. Personally I´d keep Silva centrally, as De Bruyne with his pace, strength and legs seems a better fit for a wing position in my book. Whether he plays to the left, as he might prefer judging from his passing density plot, or to the right to accomodate Raheem Sterling who seems to do a lot better as a left winger than a right winger, I´ll leave for Pellegrini to decide. Either way, Citys squad is looking awfully interesting right now.

_________________________________________________________________________________________________

Data from

opta

Märkt , , , , , ,

Anthony Martial – $$$$

Deadline day is happening right now and even though it hasn´t been announced yet, Man United are expected to confirm the signing of Anthony Martial from AS Monaco before the actual deadline. There´s been some variation in the quoted transfer fees, but the consenseus seem to be that United will pay around 36M£ right away with the deal potentially rising to somewhere in the neighbourhood of 55M£, making Martial the most expensive teenager ever.

So, who is this guy that United is going to spend a fortune on, and more importantly, how good is he? To me, that´s a really good question.

Martial is a French striker who will turn 20 in December. To date he has played 2590 minutes of Ligue 1 (as a comparison,John Terry played 3420 minutes last SEASON) football according to WhoScored, scoring 10 non penalty goals and providing six assists for a total of 0.35 NPG90 and  0.21 Ass90. The goal scoring numbers are about average for a striker in the top 5 divisions, which given his age is an encouraging sign, even though Ligue 1 is considered the weakest out of the five leagues.

The chart below shots the location of all open play shots taken by Martial last season. He takes the vast majority of his shots inside the penalty area and close to the center. Rather than being an allround Sergio Agüero/Robert Lewandowski type of player, Martial looks more like a presence inside the penalty area, judging by his shot map.

MartialShots

When looking more closely at the underlying shots numbers from last season, it is clear that Martial is not the finished product. His Expected Goals per 90 minutes played is significantly lower than both Falcaos and van Persies, two former world class strikers now in decline that no longer belong to the club.

MartialComp

Clearly, Martial isn´t bought solely on his current abilities, but because of his potential, as is the case with pretty much any 19 year old. Given the hefty price tag, that potential needs to be something else. I´ll admit to seeing very little live action of Martial, so let´s try and look at a few more numbers to try and gather what to expect.

The first two tables are from a summary post I did in Swedish on Ligue 1 2014/2015. Martial turns up in the top 15 for both NPG90 (15th) and ExpG90 (13th) in Ligue 1 last season.
lig1expg90

lig1npg90

The good news is that Martials goal scoring up to this point looks sustainable according to the Expected Goals Model, and that he is already measuring up with the senior players in Ligue 1, beating both Lacazette and Gignac in ExpG90. The bad news is that it is again made clear that he is not the finished product. He might become a world class striker, but he isn´t one right now.

So the key to this transfer is undoubtedly potential. So how unique is it for a player of his age to produce these kind of numbers at a senior level? The following tables are from a piece I did (in Swedish once again) late last season on attacking players under the age of 21. Please note that the numbers are slightly outdated as they were first posted a few weeks before the end of last season.

ypNPG901415ypExpG901415Martial shows up in the top 15 once again, but as was the case in Ligue 1, he doesn´t make it all the way to the top of the list. He is very good for his age, but not the very best, the biggest concern being the modest shot volume of 2.34 shots per 90 minutes. An interesting side note is the amount of players on the list above that have already been picked up during the transfer window.

To sum it up, United are paying a heck of a lot of money for a player that has less than a full seasons worth of minutes under his belt, and is currently producing average offensive numbers. The people that have seen Martial play a lot more than I have seem to be impressed, but for that amount of money, I remain a little skeptic given how little he has actually played and achieved. Not all 19 year olds develop the way you hope, and who knows what a 55M£ price tag will do to you.

The decision to loan Januzaj (and possibly Wilson as well) out and get rid of Javier Hernandez for peanuts (in comparison) leaves United somewhat dependant on a 19 year old kid who´s never played in the Premier League, La Liga or Bundesliga before. Quite baffling.

Märkt , , ,